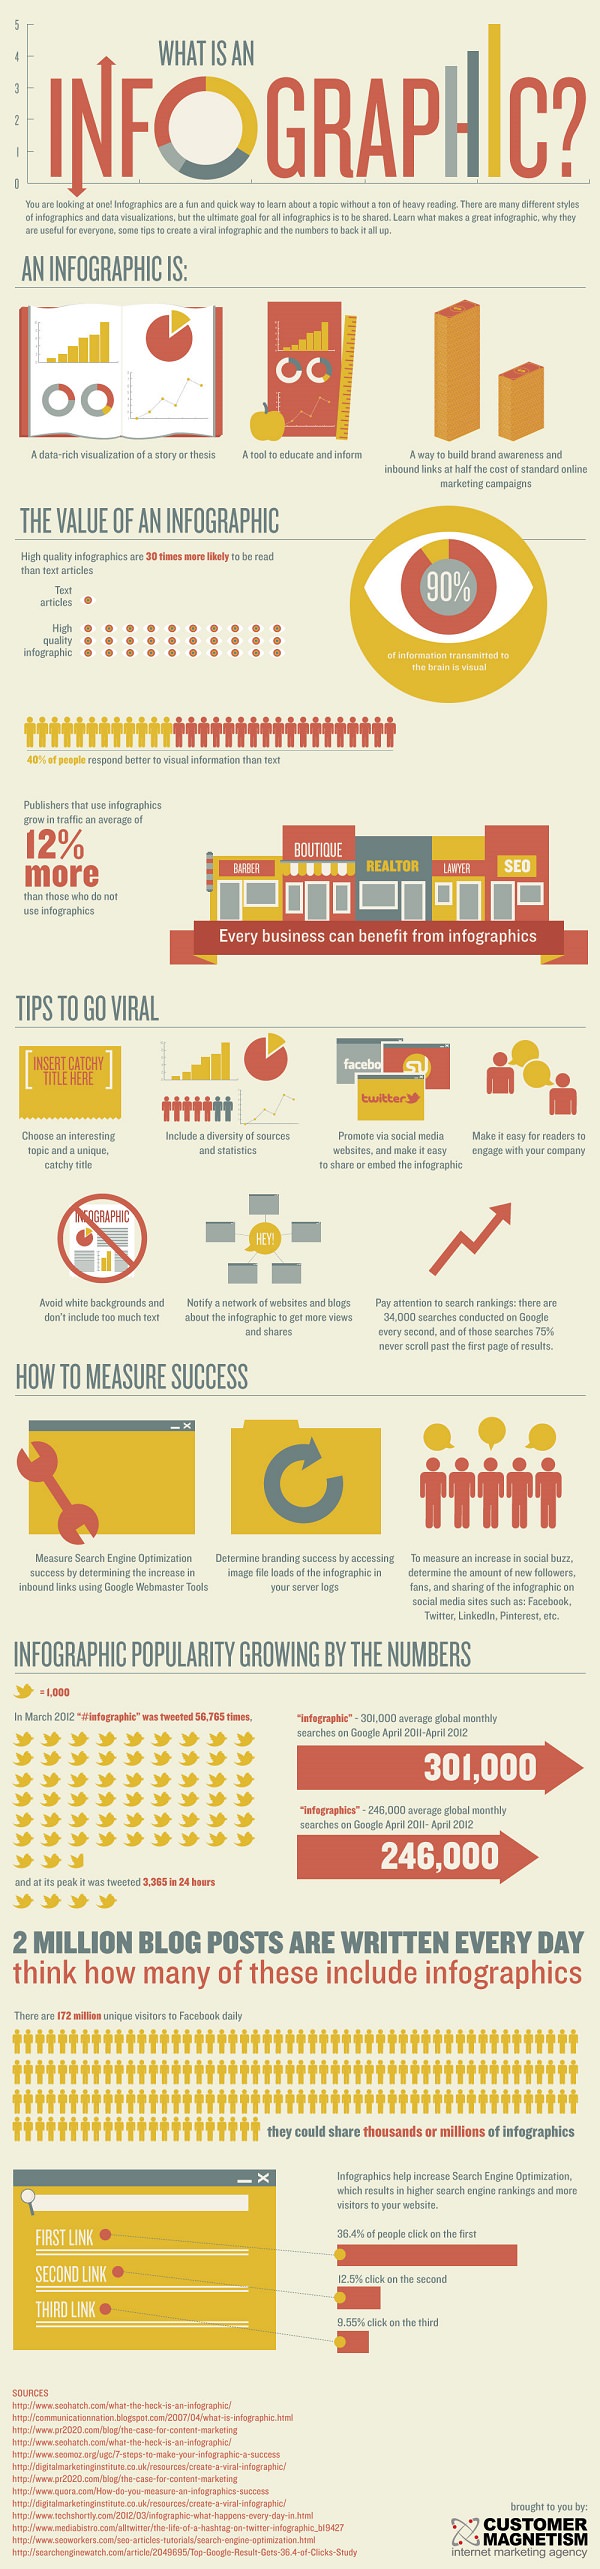
What is an Infographic?
-An infographic is a visual representation of information, presented in the form of charts, graphs, symbols, and legends.
-It is a simple yet impactful layout of pertinent information displayed in a form that is easy to understand.
-The modern-day equivalent to ancient stone inscriptions, cave drawings, and Egyptian hieroglyphics.
Key Elements of an Infographic
-Colors
-Icons
-Fonts
-Images
Types of Infographics
-Number Infographic: Illustrates the correlation between statistical numbers and the subject under consideration.
-Process Infographic: Includes decision trees, flow charts and directional charts that elaborate the decision-making process.
-Informational Infographic: Includes visual elements, but the emphasis is more on words
-Timeline Infographic: Includes information grouped in a chronological order; used wherever there is no restraint of space
-Chart Infographic: Used to display data for the purpose of comparison.
-Pie Charts Infographic: Used to show off different sections of a particular category for the purpose of comparative analysis.
-How-To Infographic: Includes steps of a particular protocol.
-Resume Infographic: Depicts your credentials, professional record and work experience in a visually appealing format.
Tips for Making Relevant Infographics
-Take advantage of colors for evoking emotions. Red projects trust, blue projects independence, yellow exudes cheer and green suits environmental issues.-Popular font choices include Arial, Calibri and Times New Roman. Use Serif fonts for a formal look, Sans-Serif for a modern feel and Script fonts for casual layouts.
-Use icons in place of legends to club information in tiny spaces. Label them correctly.
-Use images that are subject-relevant and have a complimentary color palette.
How Popular are Infographics?
Search rate for infographics has risen by 800% in the past decade. On a scale where 100 refers to maximum search interest
UAE: 31
U.K: 31
Netherlands: 32
Australia: 34
United States: 36
India: 36
New Zealand: 45
South Africa: 54
Philippines: 62
Singapore: 100
Surprising Facts About Infographics
-Infographic production rises by 1% every day
-The search query “Infographic” generates over 15 million results
-More than 87% visitors will read text only when it’s incorporated in an infographic
-Use of infographics can enhance brand awareness by 82%
-Content depicted in the form of an infographic will appear 53% more compelling.
-Use of visual content has risen by 400% since 1990
-The use of visual data has risen by 9900% since 2007
What is an Infographic via Customermagnetism